
There is much to like about Australia’s rollout of hepatitis C drugs, but there are disturbing disparities as well
It’s the second anniversary since the government subsidised the revolutionary treatments for hepatitis C, and tens of thousands of individuals were able to become free of the chronic disease.
It is estimated that one in five people living with the disease was treated within the first 12 months of the direct-acting antivirals being listed on the PBS.This makes Australia one of only a few countries in the world set to reach the World Health Organisation’s elimination targets, which include both diagnosing 90% and treating 80% of all those with the infection, by 2030. We may even beat that target by a few years.
But it’s not all good news.
Major disparities in treatment rates across the country have been revealed with the publication of Australia’s first national mapping project of prevalence and treatment of the disease. Instead of simply comparing states, the report now allows anyone to look at how their primary health network compares with others.
The Australian government has been a world-leader in its dedication to making the drugs, which have a cure rate of greater than 9o%, available to everyone, regardless of their status, such as being an injecting drug user or a prison inmate.
Yet despite this, it has become clear that there is substantial inequality across the country when it comes to who gets treated. In some regions, one in three people living with hepatitis C has been treated and likely cured, whereas in other parts of the nation the rate is only one in 14.
In a country such Australia, which boasts a universal healthcare system, such disparities in treatment rates raise ethical considerations. Especially when the figures suggest it is those in rural and remote areas, and indigenous Australians, who are missing out the most.
The report shows that prevalence rates of hepatitis C are among the highest in rural and regional PHNs, at 1.87% in the Northern Territory and 1.64% in western NSW and lowest in metropolitan areas such as northern Sydney (0.41%) and eastern Melbourne (0.52%). But overall, treatment rates are conversely lowest in those areas that have the highest rates of people living with chronic hepatitis C.
“If you have more people living with hepatitis C then that means there is more need there and you have to work harder to get the treatment proportions up,” infectious disease physician Associate Professor Benjamin Cowie, who helped develop the mapping project, said.
The Australasian Society for HIV, Viral Hepatitis and Sexual Health Medicine and the Doherty Institute originally started publishing mapping reports on hepatitis B back in 2012.
Professor Cowie, who is director of the WHO Collaborating Centre for Viral Hepatitis at the Doherty Institute, said these were initially designed to help health workers determine what languages resources were needed for translation and to help community organisations understand what the demographics were in their area.
But those early reports also revealed large disparities in treatment uptake, prompting Professor Cowie and his team to propose a similar project in light of the introduction of the new hepatitis C drugs.
Until now, similar information on hepatitis C was mostly limited to detail about states and territories.This report not only provides information on each PHN, but also drills down into specific areas within each PHN.
Instead of seeing comparisons between areas as large as one and a half million people, clinicians and policy makers can now see the variation in populations as small as 30,000 to 130,000 people.
Rather than comparing 31 PHNs, policy makers and public health workers now have access to data on 335 local areas.
Researchers used data from the Medicare Benefits Schedule, Pharmaceutical Benefits Schedule utilisation data, as well as publicly available population data about notifications of communicable diseases, to develop the report.
“One of the really fundamental reasons we wanted to produce this report is to start having those conversations about equity and access across the country,” Professor Cowie said, adding that this was especially important when hepatitis C was the leading cause of liver cancer deaths in the country, itself an increasing cause of death for Australians.
“If you look at the Australian average for the first year of treatment uptake, the idea that 19% of people living with hepatitis C received treatment for that condition that year is amazing,” he said.
“But there are some places in Australia where more than a quarter of those living with hepatitis C have been treated, and conversely there are some parts of the country where less than 10% have.”
Adelaide topped the scoreboard for treatment uptake across the PHN, where 26% of those with hepatitis C had been treated.
An “amazing achievement”, Professor Cowie called it.
The north coast of NSW also had an admirable 25% treatment uptake, while the lowest take up, at 7%, was in western Queensland.
Treatment uptake was generally poorer in regional and rural Australia.
In places such as the Northern Territory, which has treated 9% of its infected population, the relatively small population is spread across a large geographical area, adding to the barriers facing health service providers.
But it wasn’t simply a regional-metropolitan split that determined the uptake.
For example, some parts of Brisbane had only treated 8% of their population living with hepatitis C within the first year, while others were able to treat 25%.
“If you’re getting some parts of the country where more than double the proportion of people living with hepatitis C are receiving treatment than others, it means there are clear opportunities for improvement and lessons to be learned,” Professor Cowie said.
This kind of patchy coverage also risks undermining the country’s elimination goal, says Professor Greg Dore, head of the Viral Hepatitis Clinical Research Program at the Kirby Institute.
“It matters in the sense that if you’re truly trying to get complete control of the epidemic, as far as both stopping people dying from advanced liver disease complications and stopping ongoing transmission, you need a pretty uniform coverage to get the maximum potential benefit,” the infectious disease physician explained.
As a result, any big pockets of the population that are missing out on treatment may continue to provide sources of ongoing transmission. The movement of people from low-treatment areas creates a risk, in particular to those who have been treated and cured, but are still injecting drug users.
“There is no doubt that the best strategy is to try and get this uniform treatment coverage, particularly among the high-risk population, and get the amount in the virus pool moving down across all geographical areas.”
To understand why areas such as Adelaide, which treated one in four of its hepatitis C population in the first year, have done so well, Professor Cowie and his colleagues looked at the concentration of specialists in the area.
“Again, there’s some real contrast here,” Professor Cowie noted.
“When you look at the Adelaide Primary Health Network it’s got the highest number of specialists per estimated person living with hepatitis C.”
Per 1000 people living with chronic hepatitis C, Adelaide tops the charts at just under 25 specialists.
In contrast, places with poor treatment uptake such as western NSW, country Western Australia and the Northern Territory don’t even have five specialists per 1000 people.
But specialist density isn’t the whole story, either. Take northern NSW, an area that includes the towns of Byron Bay, Lismore and Ballina, for example. That area is in the top three for prevalence, while at the same time having one of the highest treatment rates in the country at 25%.
Yet it has one of the lowest rates of gastroenterologists and other relevant specialists per thousand people living with chronic hepatitis C.
“One possible answer there is that there is a particularly engaged GP workforce,” Professor Cowie said.
“Another possibility is that all those people are going across the border – going to the Gold Coast and to southeast Queensland to get treatment – and that is why the north coast has disproportionate levels.”
The engagement of the GP workforce certainly matters in the elimination effort, as it is one of the major features in Australia’s quest to remove barriers to treatment.
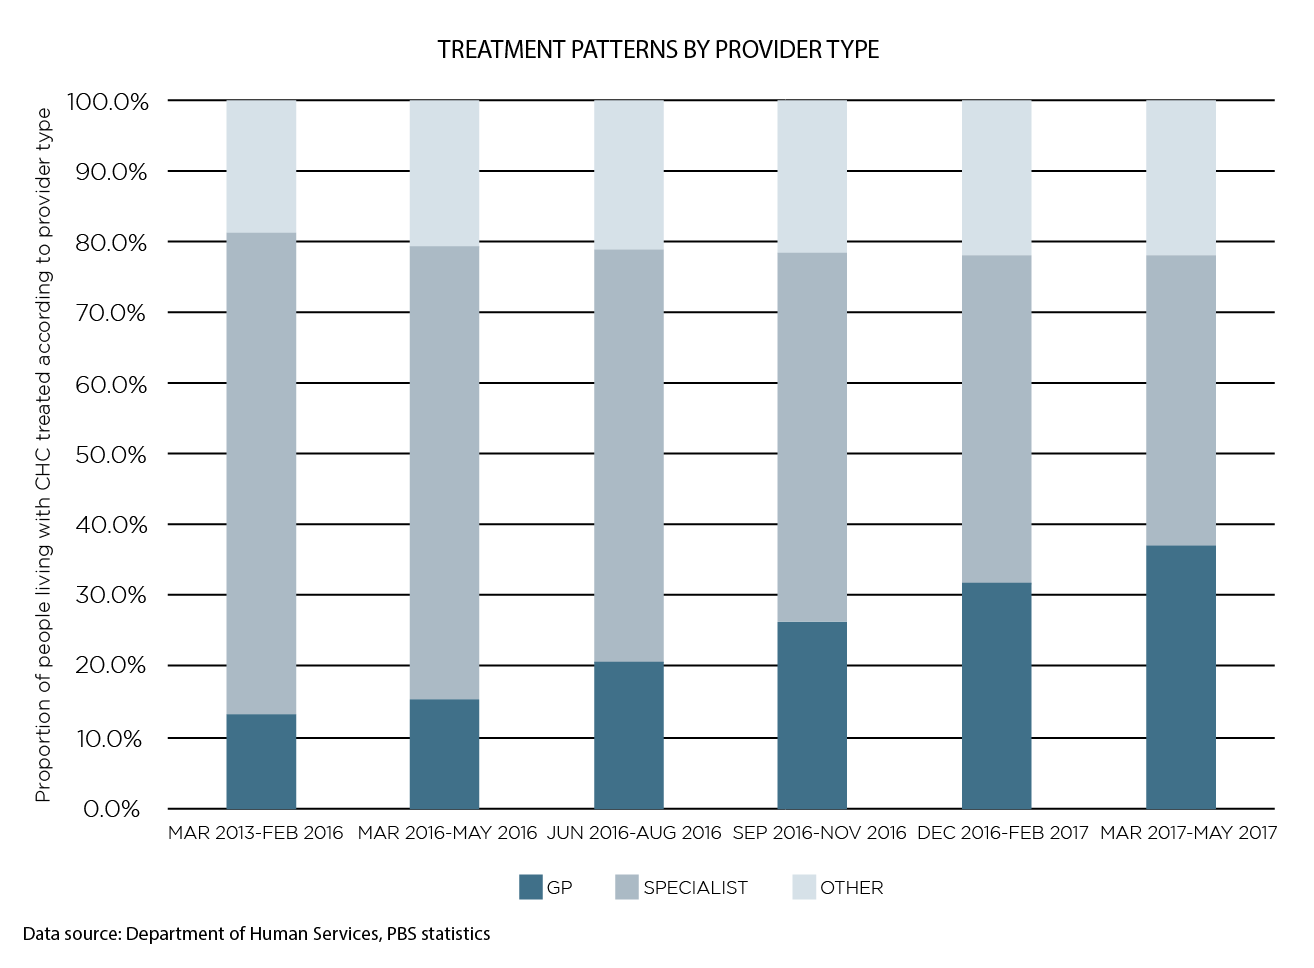
The report found that GPs accounted for a steadily increasing portion of the prescriber pie. Before the direct-acting antivirals were introduced, GPs accounted for 14.6% of the prescribers, but by the start of 2017 this had grown to 36.8%.
In every state, barring Victoria and NSW, this accounted for the lion’s share of prescribing.
Still, the report identified what appeared to be a gap in the cascade in primary care. The researchers found that three in four HCV RNA or genotype tests were ordered in primary care, primarily by GPs.
However, treatment hasn’t quite followed, with just over half these patients subequently prescribed treatment by these nonspecialists.
How to use it
On average, just shy of 1% of the Australian population is estimated to have hepatitis C. There was a 12% increase in the rate of diagnosis following the March 2016 listing of the drugs, likely due to renewed efforts to test and treat.
“There is no doubt that this sort of mapping exercise is incredibly important, to monitor and evaluate how things are rolling out and to potentially guide service development,” Professor Dore said.
The federal government-commissioned report would allow GP education providers, and workers in the state health department or primary health network, to better make decisions about where to run education events or use local resources to address gaps and plan responses, Professor Cowie said.
He was optimistic that both individuals and groups would be able to use this report as a tool to improve their local areas, based on success stories from the hepatitis B mapping project.
Infectious disease specialist Dr Jane Davies said the previous reports for hepatitis B had been massively helpful in her work.
“It really comes down to having some objective evidence and objective parameters that you can refer to,” Dr Davies, the clinical lead for viral hepatitis at the Royal Darwin Hospital, said.
One of the most important ways it added value was in improving clinical service delivery, she said.
It helped clinicians know their area and discover where the gaps were, to guide the quality improvement process. “The other area where I have found it helpful is being able to articulate and advocate for improved resources, whether that be staff or equipment,” she said. Having objective measures to put into business plans and requests had been compelling to decision makers.
Using the information in the mapping report, she was able to successfully advocate for those resources and better address the hepatitis B problem in the Northern Territory.
Without it, information would have to have been gleaned from a number of disparate sources, leaving interested parties to sift their way through statistics and measures across different states and jurisdictions.
Collating information on cascades of care, how many people were in treatment, diagnosed, how that’s changing and so on, could be “very difficult to pull together,” Dr Davies said.
Eventually, the small team behind the mapping projects hopes to have a combined hepatitis B and C interactive map that enables people to search and compare areas with greater ease.
Future reports on hepatitis C, which will be published annually, are set to include the level of GP prescribing in each area, liver cancer incidence, and ideally information on priority groups, such as Aboriginal and Torres Strait Islander and culturally and linguistically diverse populations, as well as those in prisons.
This will be vital to understanding our progress as the years go on.
Because, as Dr Davies says, “information is power.”
